What can I see in Sayved’s charts and reports?
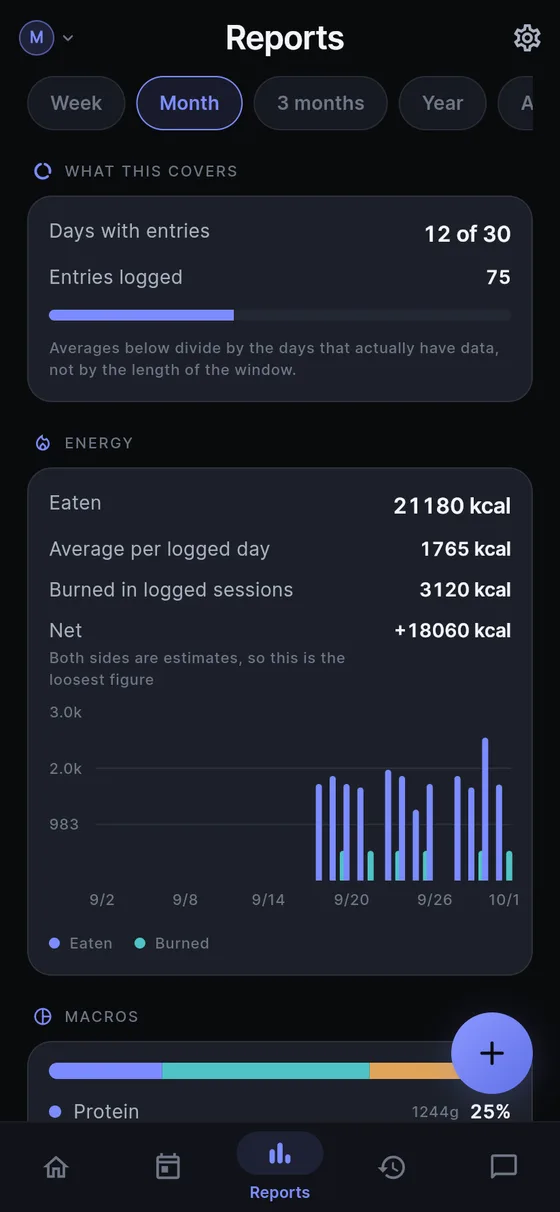
Reports is the tab for looking back. Everything on it is calculated on your phone from entries you already made, so there is nothing to configure and nothing to enter twice. You choose how far back to look: a week, a month, three months, a year, or all time.
Each topic gets its own card, and a card appears only when you have logged something for it. If you never record weight, there is no empty weight card nagging you. The cards are:
- Energy. Eaten, burned in sessions and a daily chart, plus the optional calculated baseline and Net.
- Macros. Protein, carbs and fat as a share of energy, an average protein per logged day and a stacked daily chart.
- Training. Sessions, time, distance, time under added load and the heaviest load, with counts by activity and muscle group.
- Steps. Total, average per logged day and a daily chart.
- Sleep. Average night, nights logged, quality out of ten and night wakings, with a night-by-night chart.
- Body. Latest weight and the change over the window.
- Mind. Averages for mood, energy, stress, focus and creativity on the 0 to 10 scale.
- Supplements and medication. Doses and units summed by what you took.
- Health. Symptoms, with the worst severity noted.
- Everything logged. Counts by category.
Is there a weekly nutrition report?
Yes. Choose Week, and the Energy and Macros cards become a weekly nutrition report: what you ate each day, the split of protein, carbs and fat and your average protein per logged day. The macro tracker page covers how the numbers are estimated, and the calorie deficit tracker page explains the optional baseline that can join the Energy card.
A weekly report is the right size for a dietitian visit, a coach or simply your own curiosity. For a longer story, change the window to three months or a year without logging anything new.
How are sleep and mood charted?
The Sleep card shows your average night, how many nights have a record, the average quality out of ten, and the number of night wakings, followed by a chart of each night. The Mind card lists averages for the things you rated, with the scale printed beside it: mood 0 worst and 10 best, stress 0 relaxed and 10 overwhelmed, focus 0 scattered and 10 deep.
The wording on that scale matters. Sayved uses one 0 to 10 convention everywhere: the number is how much of the named thing there is. So a high number is not automatically a good number, pain 9 is a lot of pain, and the app never colours or arrows it. If you said “mood is good”, the entry converted the word to a number and showed you the conversion, and you can adjust it.
See sleep diary and mood journal for what to say so each night and day lands cleanly in these cards.
Why does Reports show coverage first?
At the top of every report is a card called What this covers, with the days in the window that have entries and the total number of entries. It exists so an average over three logged days is not mistaken for an average over a month. Averages elsewhere divide by the logged days, not by the length of the window.
This card is about data confidence, not discipline. It is explicitly not a streak. There is no target for how many days to log, and nothing changes if the number is low. A day you did not log is information, not a failure, and the charts treat it as a blank.
What do the charts leave out on purpose?
Sayved describes and never grades. You will not find a score, a rating of your week, a comparison with the previous period, a percentage complete or a colour that reads as pass or fail. Sayved also never volunteers an interpretation, such as “your sleep is worse on days you drink coffee”. That kind of statement from an app can be a coincidence that reads as a finding.
If you want to look for a connection, ask: “How did I sleep on the days I trained late?” and Ask your health history answers from your own entries, and says so when there is too little data to answer fairly.
There is also a footer under the cards, for a reason. Food and exercise numbers are estimates, so anything summed from them is an estimate too, and every figure is built from your own entries.
How do I take a chart to my doctor?
Charts are for you to read on the phone. When you want something for a clinician, the doctor visit report turns a date range into a printable document, day by day, in plain language, with estimates keeping their ranges. If you want the raw rows for a spreadsheet, the CSV export gives you one row per entry, including value, low, high and confidence for each estimate.
Reports, search and export all stay available after the trial ends. Only reading new voice, photo and document captures needs Sayved Pro, at $2.99 a month after 14 days free, and typed entries still feed every chart.
 Sayved